Do Climate Commitment Act allowance prices get passed through to the pump?
While it’s too soon to draw strong conclusions, given historically high gas prices there is considerable interest in discerning how much the Climate Commitment Act (CCA) contributes to prices paid by consumers at the gas pump. Clean and Prosperous Institute (CaPI) believes it’s important to establish a baseline expectation as we continue to monitor the evolution of allowance prices and compliance costs.
The majority of compliance obligation falls on transportation fuel suppliers. Transportation fuels are the number one emissions source in Washington State, and many of the other emissions in the program are allocated free allowances for various reasons. Consumer cost impacts are, therefore, most likely to show up at the gas pump. The extent to which those costs are passed-through is complex and hard to isolate.
In this article, we present our findings of an average $0.27/gallon as the best estimate to date for the impact of this evolving program based on a comparison of changing gas prices relative to Oregon. While overall gas prices have risen more than $1/gallon from winter to summer of this year, the CCA appears to be a small share of this price increase with most of the increase attributable to an annual pattern of winter-summer price increases. Holding the CCA responsible for all or even most of gasoline price increases is not supported by real-world data.
| Timeframe | December – July, Monthly Average Increase |
| 2023 (This Year) | 24% |
| 2022 | 37% |
| 2021 | 41% |
| 2004-2019 average | 19% |
Source: Clean and Prosperous Institute analysis using EIA price data (https://www.eia.gov/petroleum/gasdiesel/)
Translating current or even year-to-date allowance prices directly to pump prices is an oversimplification that most likely overstates the program impact. Why is this?
- Unlike a carbon tax, the cap is carried out in four-year windows known as compliance periods rather than as payment due in close alignment with consumption or delivery of fuel. Allowances held retain value as assets until they are retired, and full compliance isn’t due until November 2027, which is over 4 years from today. This offers flexibility for entities to comply in the most cost-effective manner across the market of covered entities. To drive this point home, consider that only 30% of this year’s covered fuel requires compliance by the first compliance deadline in November 2024.
- The majority, 70%, of this years fuel requires compliance only by November 2027. Additionally, that compliance can be met with allowances purchased in the “future vintage” auction in May, which were designated as 2026 allowances and sold for just $31.12. An example from the the APCR auction, with 32 bidders, illustrates the complexity: 8 entities that had been participating in regular auctions did not participate, while 5 entities that had not bid in the first two regular auctions took part in the APCR. These examples highlight why it is oversimplistic to attribute auction prices directly as consumer costs.
- The fossil fuel supply chain involves many steps, each with embedded profits. And the oil industry has been collecting record profits. The final retail sale is just one stage in the process of extraction, production, and delivery. Any point where profits are retained presents an opportunity for competition and differentiation. Assuming that consumers bear the full cost ignores other opportunities for differentiation or competition among entities that are prevented from sharing sensitive market information.
- A growing body of research suggests that carbon pricing in particular may not fully translate into consumer prices. Assumptions that carbon prices would be fully passed through are often based on experiences with more direct fuel taxes such as excise taxes. Some recent examples of real-world carbon pricing pass-through include:
- Shang 2023:
- “Kotchen (2021) finds an average pass-through of 0.85 for coal, natural gas, gasoline, and diesel, based on demand-and-supply elasticities.”
- Ganapati, Shapiro, and Walker (2020)
- “For the several industries we study, 70 percent of energy price-driven changes in input costs get passed through to consumers in the short to medium run. The share of the welfare cost that consumers bear is 25–75 percent smaller (and the share producers bear is larger) than models featuring complete pass-through and perfect competition would suggest.”
- Harju et al 2022:
- “We find that diesel carbon taxes are less than fully passed through to consumer prices on average: a one euro cent increase in the carbon tax leads to a 0.80 cent increase in prices. This result indicates that the economic burden of the diesel carbon tax is somewhat split between the demand and supply sides of the market, though consumers bear most of the burden. The finding differs from the related literature on fuel excise tax pass-through, most of which has documented full or nearly full pass-through.”
- Shang 2023:
A reliable comparison: Washington vs. Oregon
This brings us back to what we can derive about prices at the pump for a program that levies a compliance obligation upstream of the consumer and obligates compliance over four-year windows. We have been tracking real-world gasoline prices closely since the beginning of the program, and only one comparison stands out as reliable: the relative increase in prices at the pump in Washington versus Oregon, as documented by AAA. The Seattle Times originally noted the consistency in gas prices between the two states, noting that “From 2015 and 2022, a gallon of regular gasoline in Washington was on average 11 cents more than in Oregon.”
This consistency makes sense, given the two states, especially the population centers west of the Cascades, are closely linked in supply and distribution with eachother but not with other states in the region (see for example this West Coast Transporation Fuels Market report). This is why Oregon and Washington prices closely track each other but can see swings relative to neighboring states like Idaho or even other regional states in the closely monitored Petroleum Administration for Defense District (PADD) 5 such as California, Nevada, and Arizona.
The spread of $0.11/gallon higher prices in Washington compared to Oregon align with the prices for regular unleaded gasoline at the most recent price minimum in late December 2022 ($3.74/gallon in Oregon and $3.85 per gallon in Washington as of December 26, 2022). We can compare how much this spread has changed in 2023 versus this $0.11 gap to get a relevant real-word datapoint. Washington relative prices jumped immediately to start 2023, increasing by a net of $0.24/gallon between December 26, 2022 and January 23, 2023. Since then, the relative price increase has stayed in a tight band, with a peak of $0.38/gallon in late April before settling at $0.22 to $0.25/gallon since June 12th. The year to date average (January 23-September 5) has been an increase of 26.7 cents per gallon more in Washington than in Oregon according to AAA data (see chart below). For a less efficiency than average (20 mpg) vehicle and an above average annual usage (15,000 miles per year), this translates to about $0.50/day in added fuel costs.
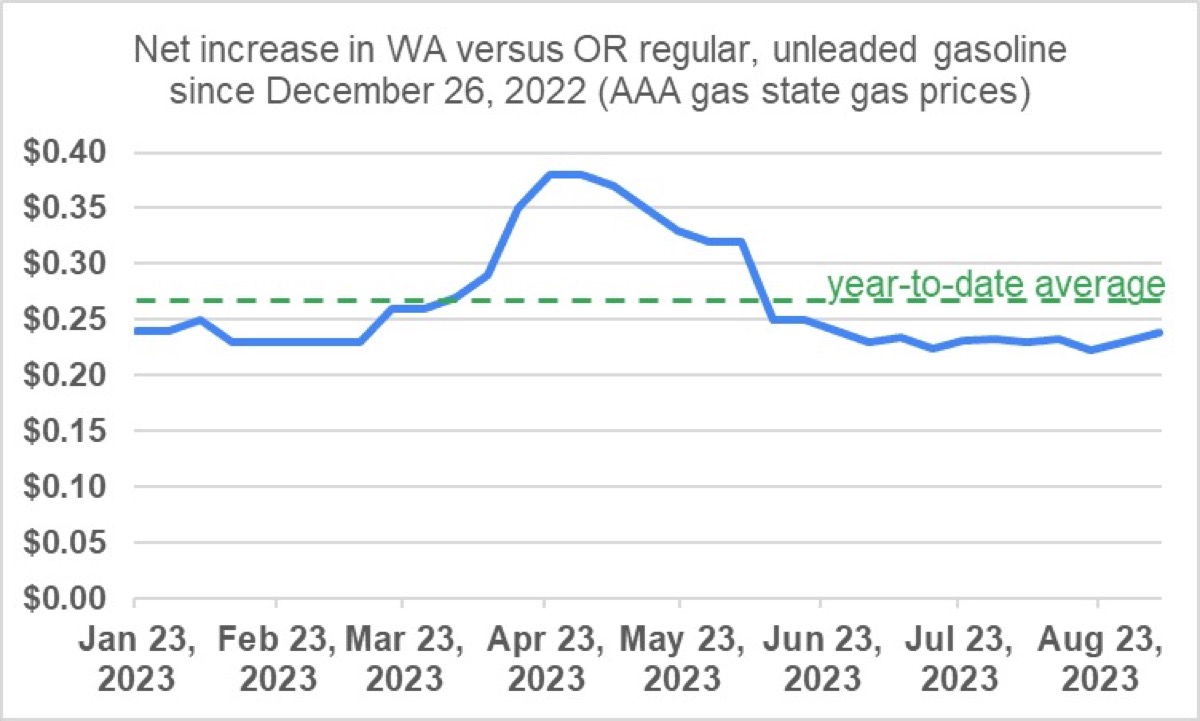
Source: AAA data, combining Clean and Prosperous Institute and Yoram Bauman data collection and analysis
Compared to a simple pass-through assumption on allowance prices that have averaged $50.32 ahead of August’s third regular auction, which would indicate a year-to-date average (through the August APCR auction) of 40 cents per gallon, the WA vs. OR metric indicates around 70% pass-through. This level of pass-through is consistent with the range described in the peer-reviewed literature.
We will continue to closely monitor this as we await a full-year and a full compliance period of allowance sales, as well as secondary market transactions. However, we believe this is the metric that reveals the most about the CCA’s average impact at the pump.
Less useful comparisons – the broader west coast region
While it’s important to evaluate all the available comparisons, not all are equally reliable. There have been some attempts to elevate a comparison of Washington net increases an the pump relative to a wider range of neighboring states. The US Energy Infomation Administration, tracks Washington, California, and regional (PADD 5, and PADD 5 minus CA) average fuel prices. The comparison of Washington gasoline price increases relative to the full PADD 5 is the likeliest source of summertime claims that the CCA has impacted gasoline prices by 50 cents, an amount greater than full pass-through. Looking at a full year of data (see chart below), we share three main observations:
- There is no consistent correlation between the CCA – either start dates or auction dates – and the price gap between the region.
- The gap peaked at the beginning of summer after a long period of low (and even negative) increases. Focusing on peaks rather than more complete averages and looking at volatile and weakly correlated comparisons is not a good approach to isolating the program impacts.
- Year-to-date average differences, though not closely correlated to program start or auctions dates unlike Oregon, are much less than 50 cents. The year-to-date average is $0.18 cents per gallon increase whether comparing to California, the full PADD 5 region, or the PADD 5 region minus California (Alaska, Arizona, Hawaii, Oregon, Nevada). That is the full-set of comparisons in the PADD 5 region available with EIA data.
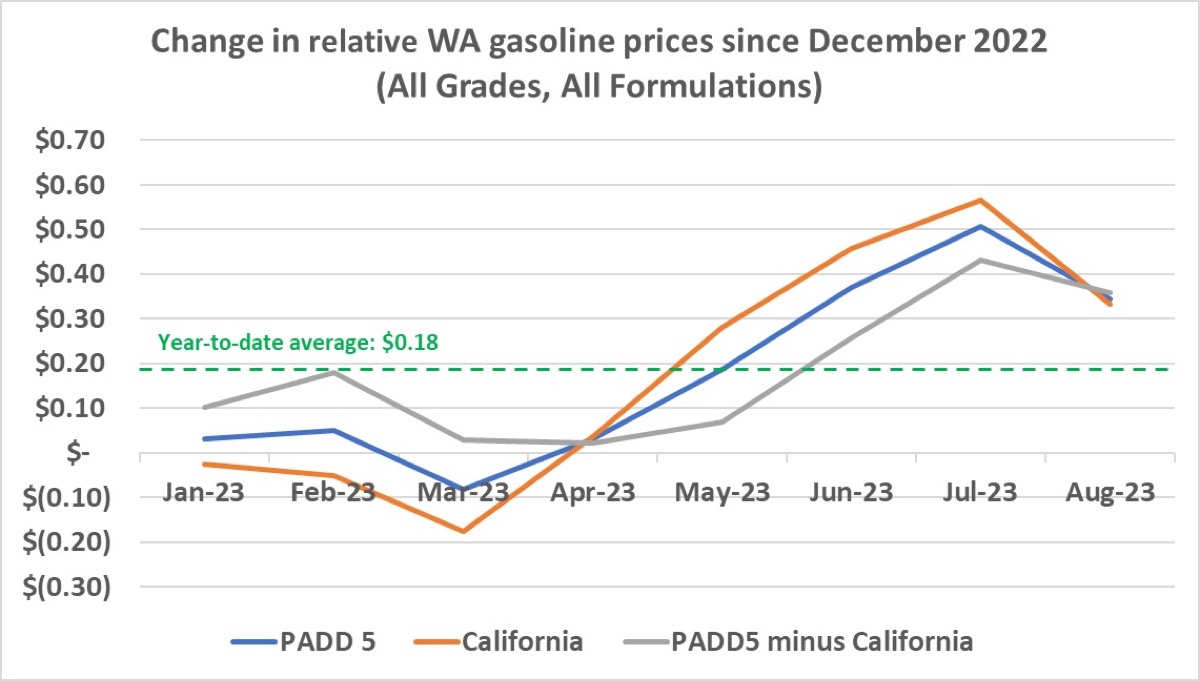
Source: Clean and Prosperous Institute analysis using EIA weekly price data (https://www.eia.gov/petroleum/gasdiesel/)
The $0.50/gallon claims that have been made coincided with the maximum spread in July 2023. Attributing the overall program impact to the highest number observed in 7 months is not a reliable measure. The overall volatility throughout the year and lack of correlation with the program indicates that other metrics are needed to capture the impact of the CCA on prices at the pump. Washington and Oregon prices are the most consistent observed to date and extending back in time.

2024 BREW International Blog Awards
Community’s Pick of the Year
Paid for by Clean & Prosperous Washington
PO Box 21961, Seattle, WA 98111
info@cleanprosperouswa.com