Take the wheel
Or rather, the mouse. Or the track pad…
Instead of asking you to read another newsletter about climate change and clean energy, we’d like to put you in the driver’s seat to explore three interactive tools that are both fascinating and useful:
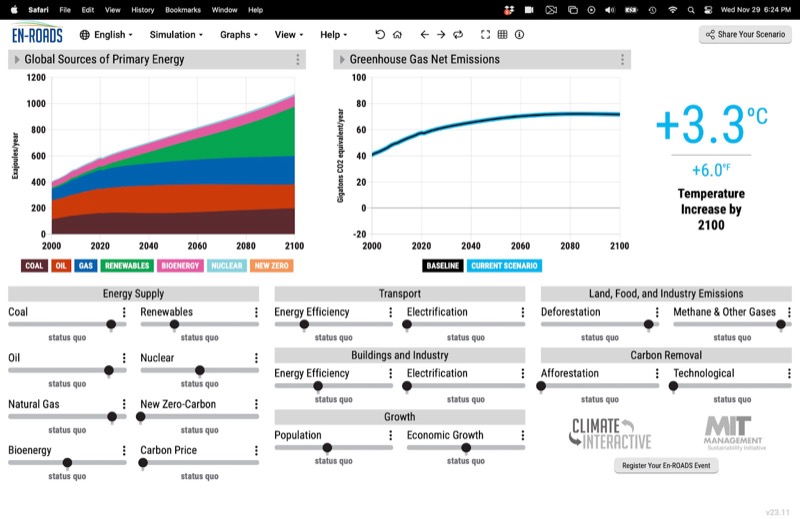
First is the En-ROADS simulator, about which Governor Jay Inslee says,
“This MIT/Climate Interactive simulator is a terrific, fantastic tool – absolutely wonderful. What I like: it is honest, shows the interesting interplay between policies, and is a bugle call about how aggressive we need to be.”
According to Climate Interactive, En-ROADS is “a freely-available online simulator that provides policymakers, educators, businesses, the media, and the public with the ability to test and explore cross-sector climate solutions.”
“Experiencing En-ROADS changes how people think about climate change and how they feel about it at a visceral level. In government offices around the world, in classrooms and corporate boardrooms, we have seen how testing alternate scenarios motivates users to step up and take action. More than 300,000 people in 85 countries—including more than 130 members of the US Congress—have taken the time to use En-ROADS.”
“Developed by Climate Interactive, the MIT Sloan Sustainability Initiative, and Ventana Systems, En-ROADS is a system dynamics model carefully grounded in the best available science, and has been calibrated against a wide range of existing integrated assessment, climate, and energy models. En-ROADS runs on an ordinary laptop in a fraction of a second, is freely available online, offers an intuitive user-friendly interface, and is available in over a dozen languages.”
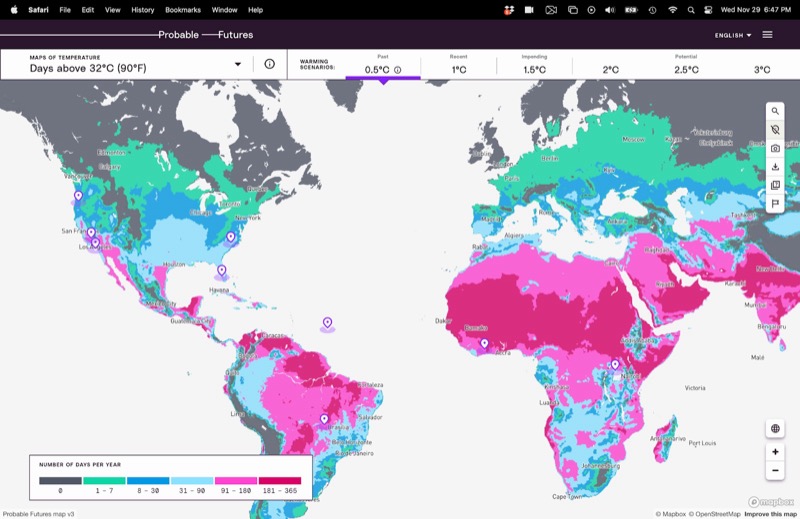
Another way to visualize various climate futures is with maps. Probable Futures shares interactive maps that illustrate the heat, precipitation, and drought effects of different climate scenarios.
Probable Futures Executive Director Alison Smart says, “When building the maps, one of the most important factors we considered as a team was which climate science questions would appear on a map. We wanted the maps to be resonant and relatable. We asked questions like, how many days will there be above 95 degrees? That 95-degree threshold is important for agriculture because the production of crops such as corn goes down precipitously when there are sustained temperatures above 95 degrees. We ask questions about wet-bulb temperature, a combination of heat and humidity, which at certain levels the human body simply cannot survive in. We ask climate models questions about human physiology, the food that we eat, or where we can live, because these are relevant in our day-to-day lives.”
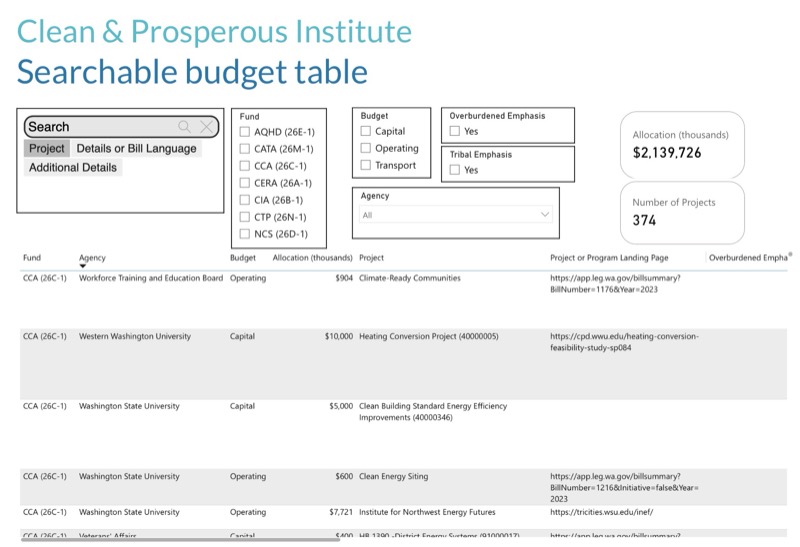
Perhaps the most useful interactive tool of all, because it allows you to navigate tangible climate-smart investments being made right here in Washington state, is the Searchable Budget Table from the Clean & Prosperous Institute.
“The Climate Commitment Act accelerates critical investments in our local communities – investments in jobs, a more efficient and resilient economy, cleaner air and water,” says Kevin Tempest, Research Scientist at the Clean & Prosperous Institute. “It is a Decisive Decade for our state’s economy and environment. We believe transparency into these investments is a critical communication and accountability tool. Residents and businesses should be able to see what the CCA is designed to deliver – and is already delivering. That’s why we built this budget tool and made it publicly available.”
What did you discover? What, if anything, surprised you? Let us know at info@cleanprosperouswa.com, or on Twitter.
2024 BREW International Blog Awards
Community’s Pick of the Year
Paid for by Clean & Prosperous Washington
PO Box 21961, Seattle, WA 98111
info@cleanprosperouswa.com